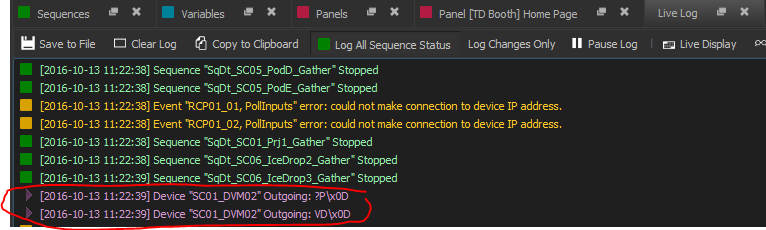
You can add devices' names by themselves to the "Watch" list to see what incoming messages are coming and going in the Live Log. You can also add their .TCPStatus variable to view connection information on TCP Devices. Do not typically add an Ethernet IP device or modbus polling device, since that usually would be too much traffic to easily view in the watch list.
Sometimes even the log and watch list doesn't tell the whole story with regard to the network. The best way to tell what's going on is to look at "Wireshark". Purchase a small managed switch like this one:
http://www.amazon.com/NETGEAR-ProSAFE-GS105Ev2-Gigabit-Managed/dp/B00HGLVZLY/ref=sr_1_1?ie=UTF8&qid=1463413750&sr=8-1&keywords=NETGEAR+5+Port+Gigabit+managed+switch
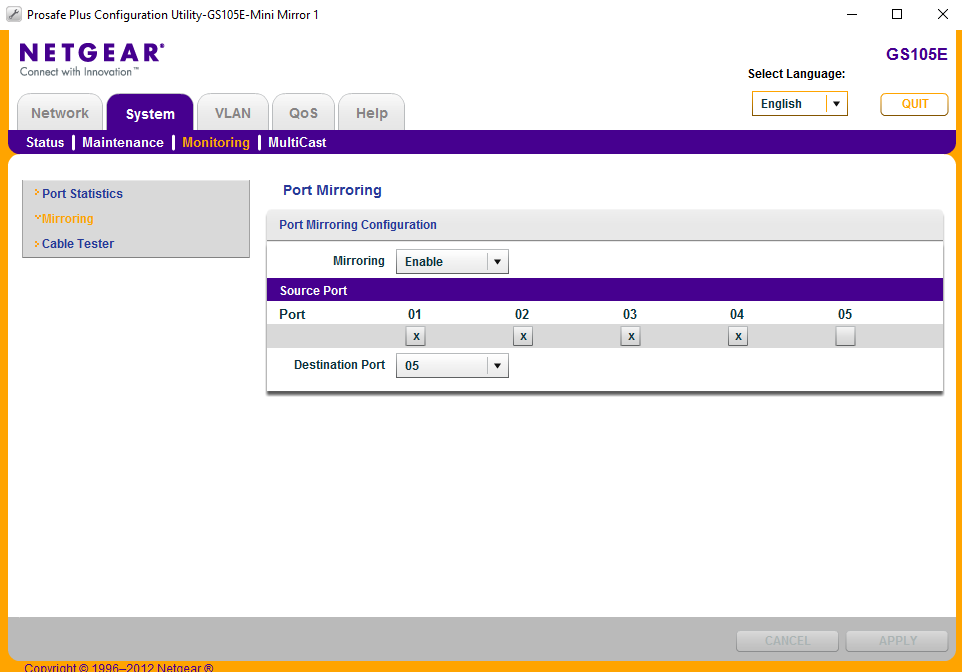
Then, configure 1 port for 'port mirroring'. This is pretty easy to setup via the Netgear setup webpages. (as shown below)
Then, you can plug in the V16Pro, your Laptop, and your Network (normally where you plug the V16Pro) into the small switch. Plug your laptop into port 5 if configured using the configuration above.
Run Wireshark, you will see all the messages going to/from the V16Pro.
To monitor using Wireshark, click "Capture" and then "Interfaces" to select your computer's Network Interface to monitor. Then click "Start"
The example below shows how some traffic with a filter for an ip address of 192.168.5.84.
The text "ip.dst == 192.168.5.84 || ip.src == 192.168.5.84" is typed into the "Filter" box.
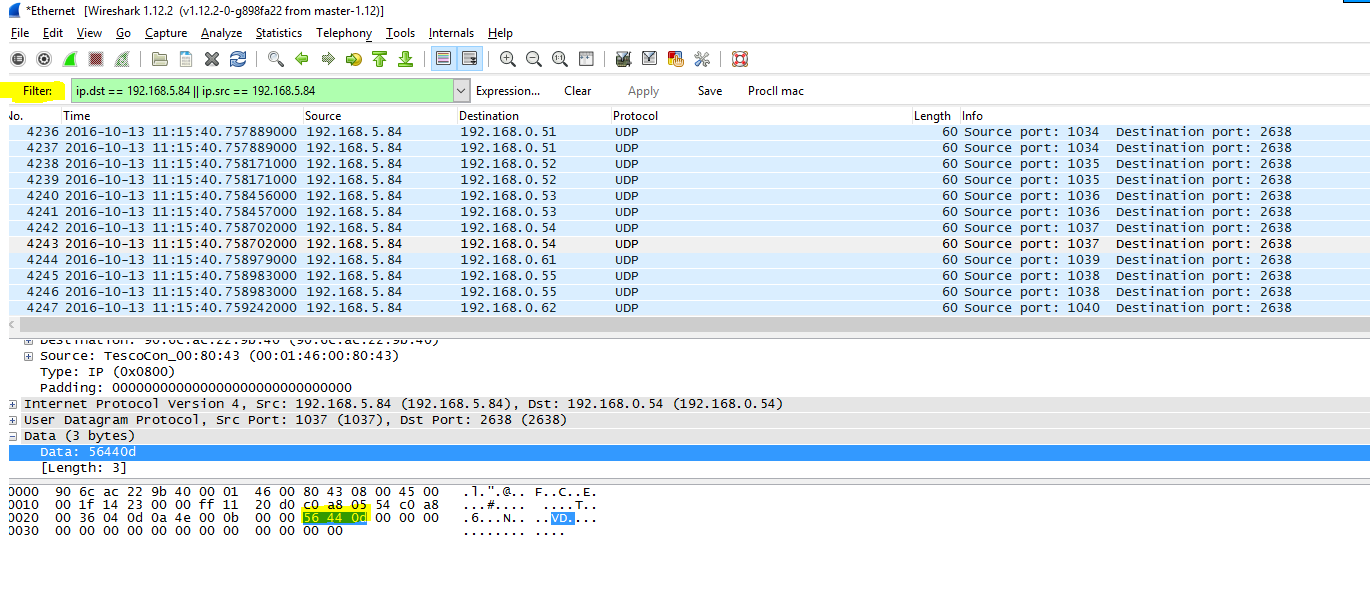
The packets and timestamp are shown in the blue section. By clicking on each line in the blue section you can see the "Data" sent to/from the controller. In this case, the data is three bytes of "VD\x0D"-- the letters "VD" and a carriage return.